Select Energy Services Reports Second Quarter Results 2018
– Adjusted EBITDA(1) of $68.2 million
– Operating Cash Flow of $64.3 million in the six-month year-to-date period, including $29.1 million generated in second quarter of 2018
HOUSTON, Aug. 9, 2018 / PRNewswire /
Select Energy Services, Inc. (NYSE: WTTR) (“Select” or “the Company”), a leading provider of total water management and chemical solutions to the North American unconventional oil and gas industry, today announced results for the quarter ended June 30, 2018.
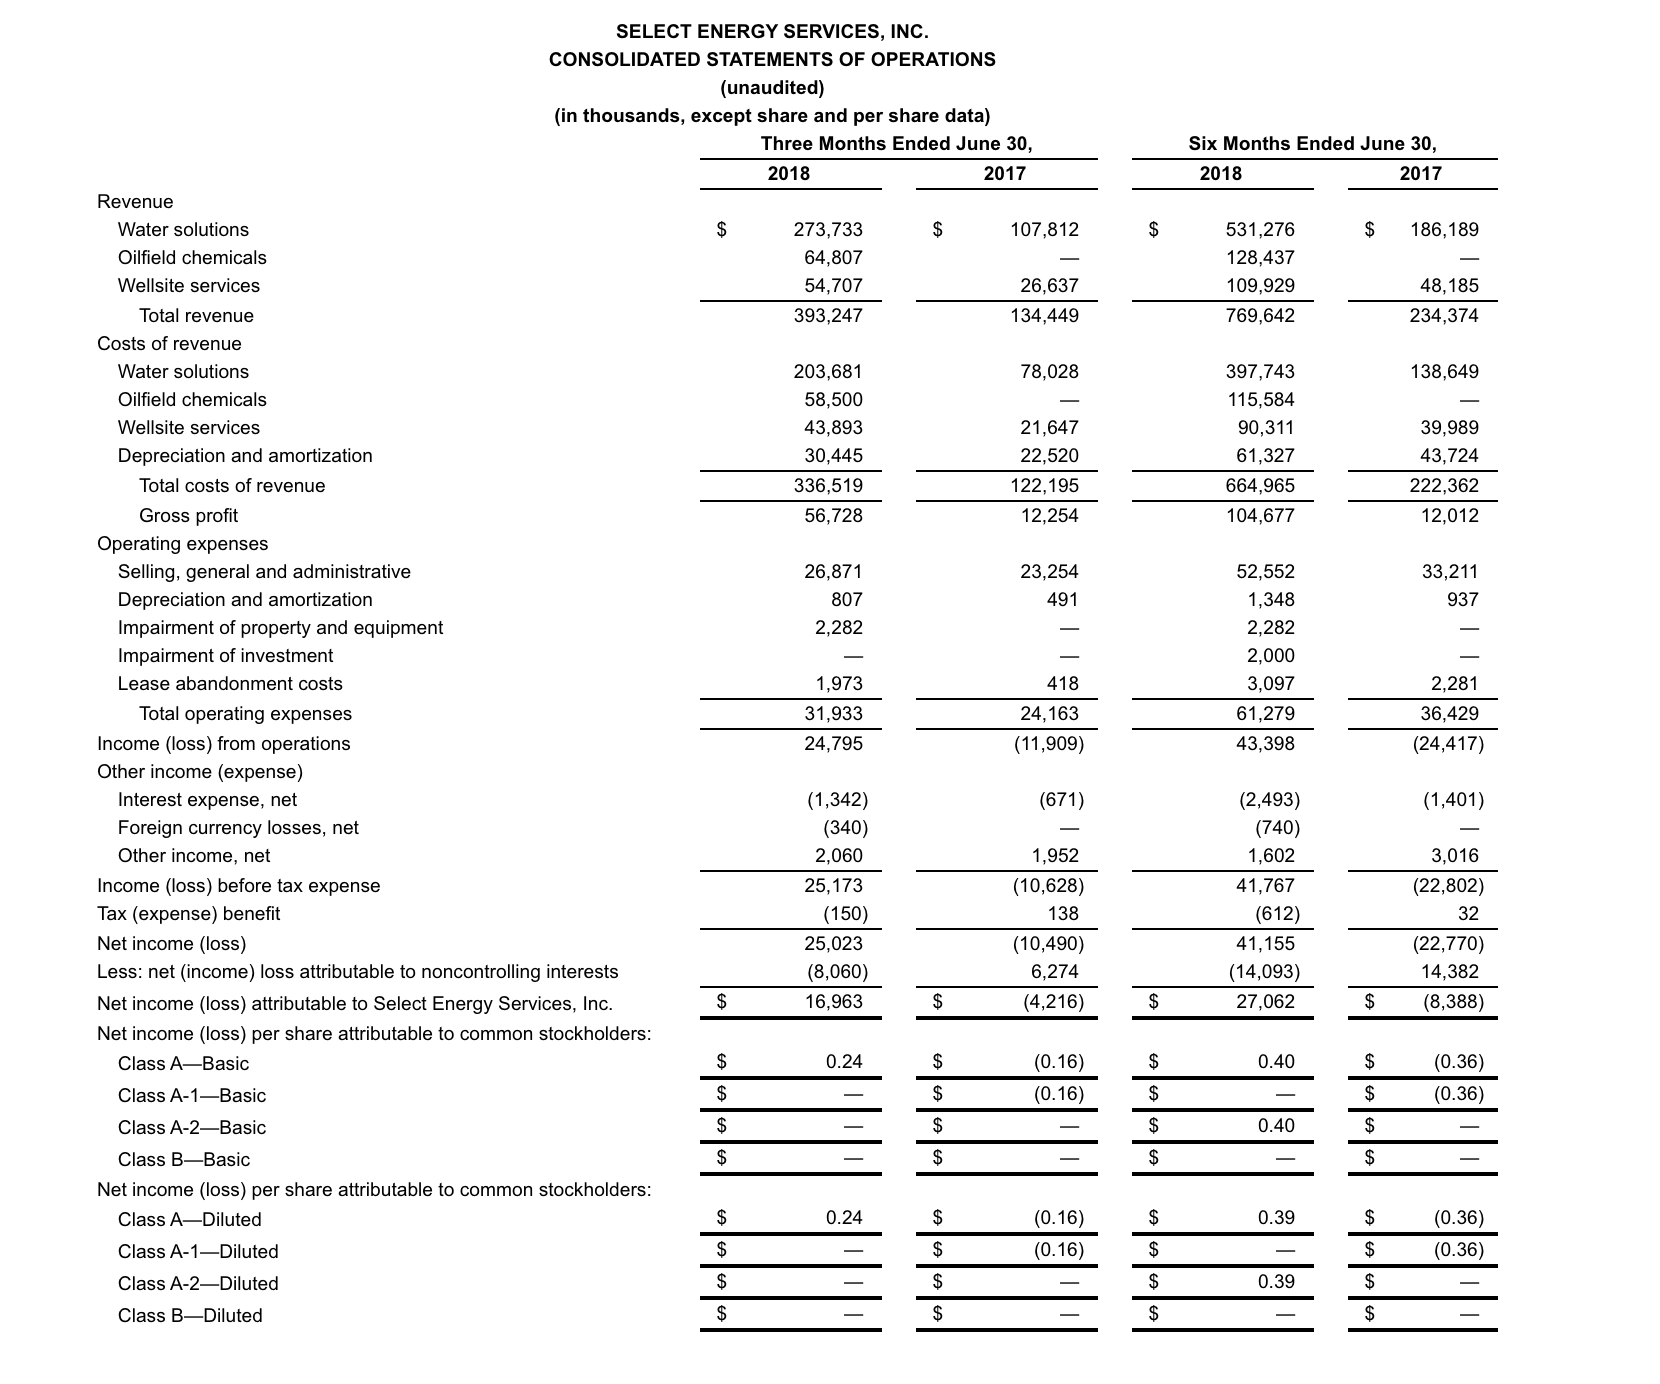
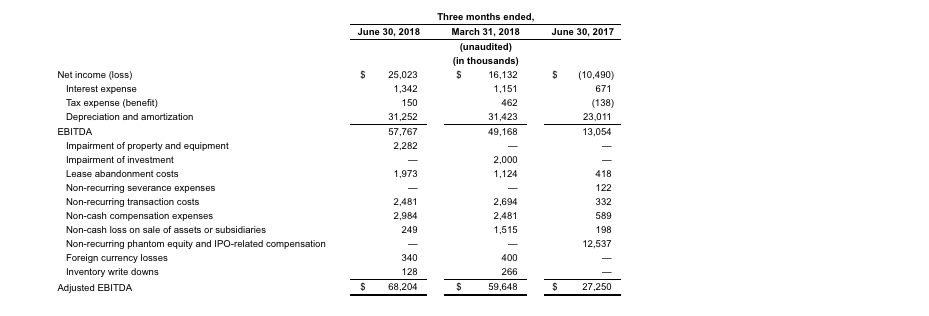
Revenue for the second quarter of 2018 was $393.2 million as compared to $376.4 million in the first quarter of 2018 and $134.4 million in the second quarter of 2017. Net income for the second quarter of 2018 was $25.0 million as compared to $16.1 million in the first quarter of 2018 and a net loss of $10.5 million in the second quarter of 2017. Adjusted EBITDA was $68.2 million or 17.3% of revenue in the second quarter of 2018 as compared to $59.6 million or 15.8% of revenue in the first quarter of 2018. Please refer to the reconciliation of Adjusted EBITDA (a non-GAAP measure) to net income in this release.
Holli Ladhani, President and CEO, stated, “The strategic rationale for the merger of Select and Rockwater is being proven out as we continue to see the benefits of our added scale and scope of services, particularly at a time when our customers are dealing with the challenges associated with more complicated, ultra-high-density drilling pads.
“With a dedicated focus on operational execution and margin enhancement, the team delivered strong incremental margins in the second quarter. We expect to see further margin improvements as we continue to identify more cost-effective ways to service our customers through investments in technology, the right equipment for today’s completions and logistically correct water sources and infrastructure.
“Select’s advanced technology, scale and access to advantaged water sources make us an ideal partner in the dynamic Permian Basin. While the region faces production takeaway challenges in the near term, we view those as temporary, and expect the Permian will continue to be an important region for our business. Fortunately, our national footprint uniquely positions us to allocate people and equipment anywhere they are needed in the short term until sufficient takeaway capacity is added to this growing basin,” concluded Ladhani.
Business Segment Information
The Water Solutions segment generated revenues of $273.7 million in the second quarter of 2018 as compared to revenues of $257.5 million in the first quarter of 2018 and $107.8 million in the second quarter of 2017. Increased customer demand for Select’s water transfer and flowback and well testing services in the Permian was the primary driver of this increase.
The Oilfield Chemicals segment, which operates through our subsidiary Rockwater Energy Solutions, generated revenues of $64.8 million in the second quarter of 2018 as compared to $63.6 million in the first quarter of 2018. Rising sales of friction reducer products offset declines in guar and crosslinker volumes.
The Wellsite Services segment generated revenues of $54.7 million in the second quarter of 2018 as compared to revenues of $55.2 million in the first quarter of 2018 and $26.6 million in the second quarter of 2017. Increased activity in our accommodations and sand hauling business lines was offset by seasonal activity declines in Canada for spring breakup.
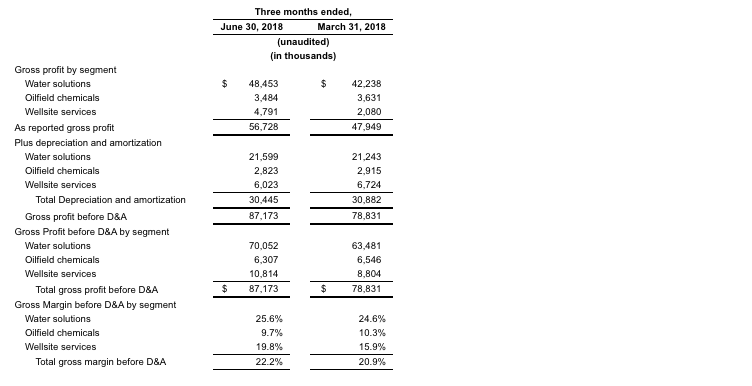
Select’s consolidated gross profit was $56.7 million in the second quarter of 2018 as compared to $47.9 million in the first quarter of 2018. Total gross margin for Select was 14.4% in the second quarter of 2018 as compared to 12.7% in the first quarter of 2018.
Gross margin before depreciation and amortization (“D&A”) for Water Solutions was 25.6% in the second quarter of 2018 as compared to 24.6% in the first quarter of 2018. Gross margin before D&A for Oilfield Chemicals was 9.7% in the second quarter of 2018 as compared to 10.3% in the first quarter of 2018. Gross margin before D&A for Wellsite Services was 19.8% in the second quarter
of 2018 as compared to 15.9% in the first quarter of 2018. Please refer to the reconciliation of gross profit before D&A (a non-GAAP measure) to gross profit in this release.
Included in the first and second quarter of 2018 segment results were full-quarter contributions from Rockwater Energy Solutions, which Select acquired in November 2017; as such, these results are not included in 2017 second quarter results.
Cash Flow and Balance Sheet
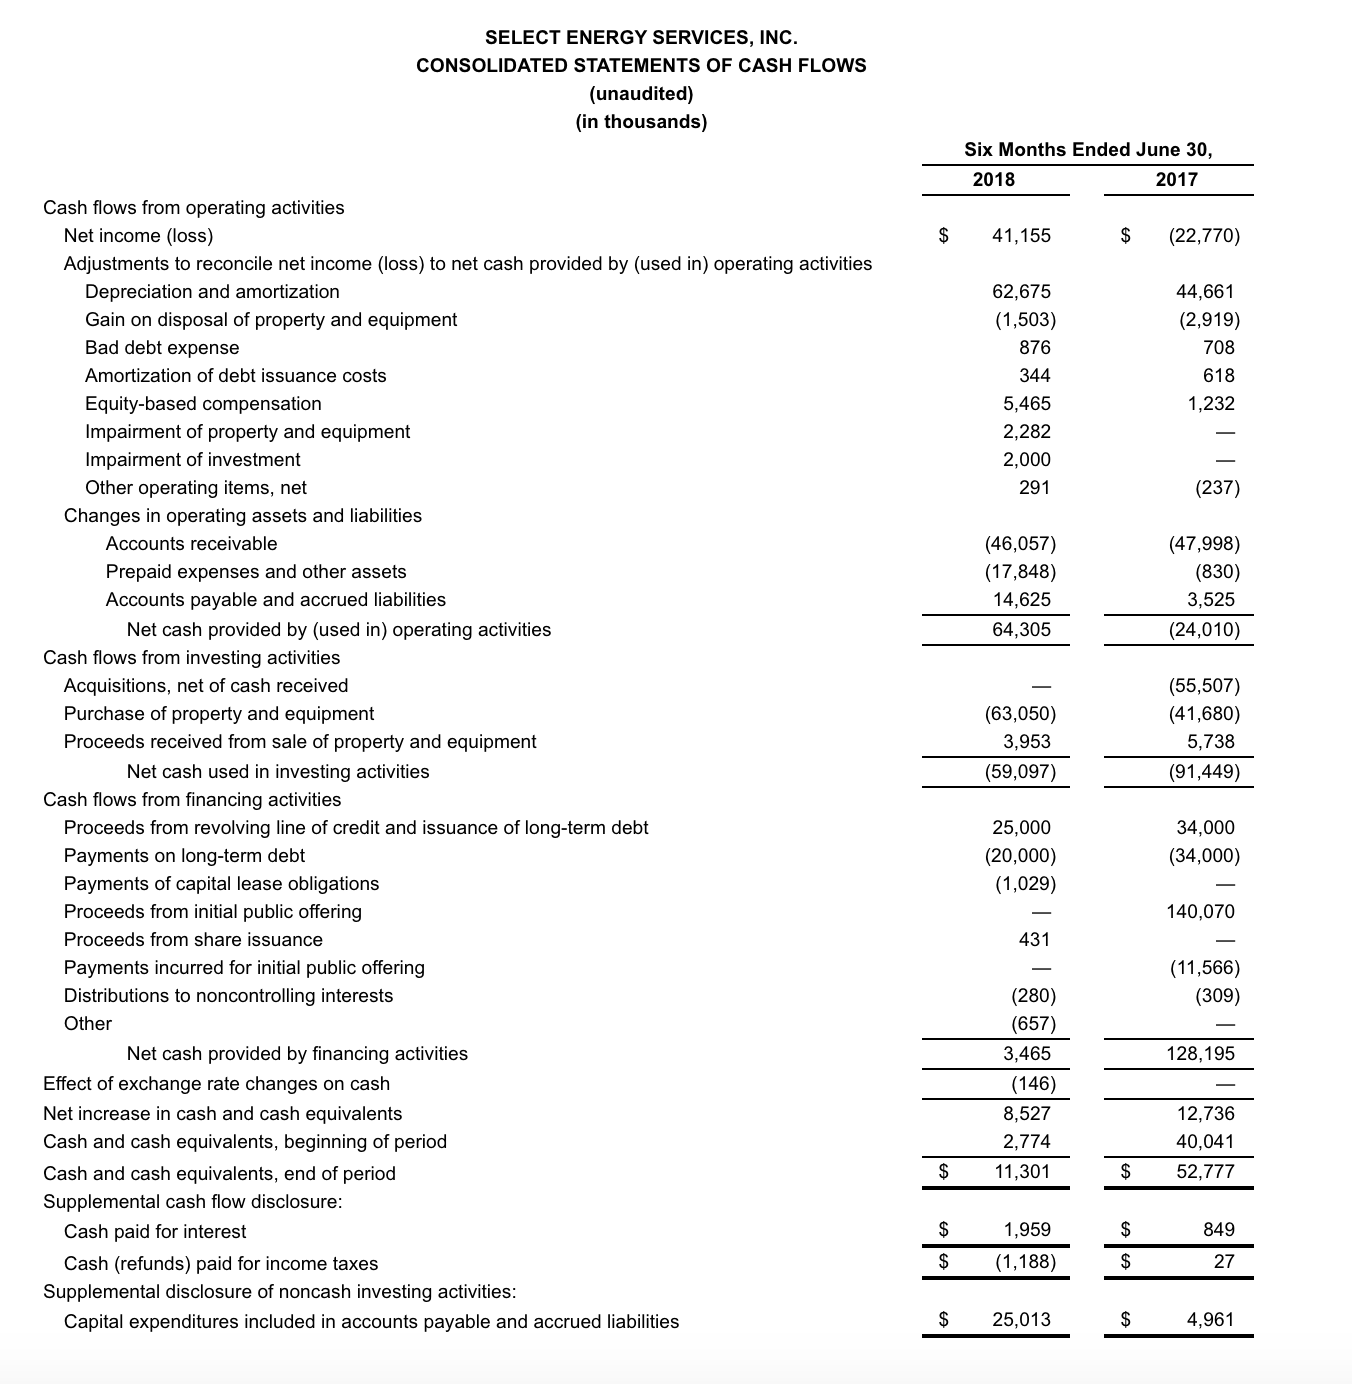
Cash flow from operations for the six-month period ending June 30, 2018 was $64.3 million, of which $29.1 million was generated in the second quarter of 2018. Capital expenditures for the first half of the year were $59.1 million, net of asset sales of $4.0 million, of which $28.1 million was spent in the 2018 second quarter. Both our 2018 year-to-date and second quarter net capital expenditures were fully funded with cash flow from operations.
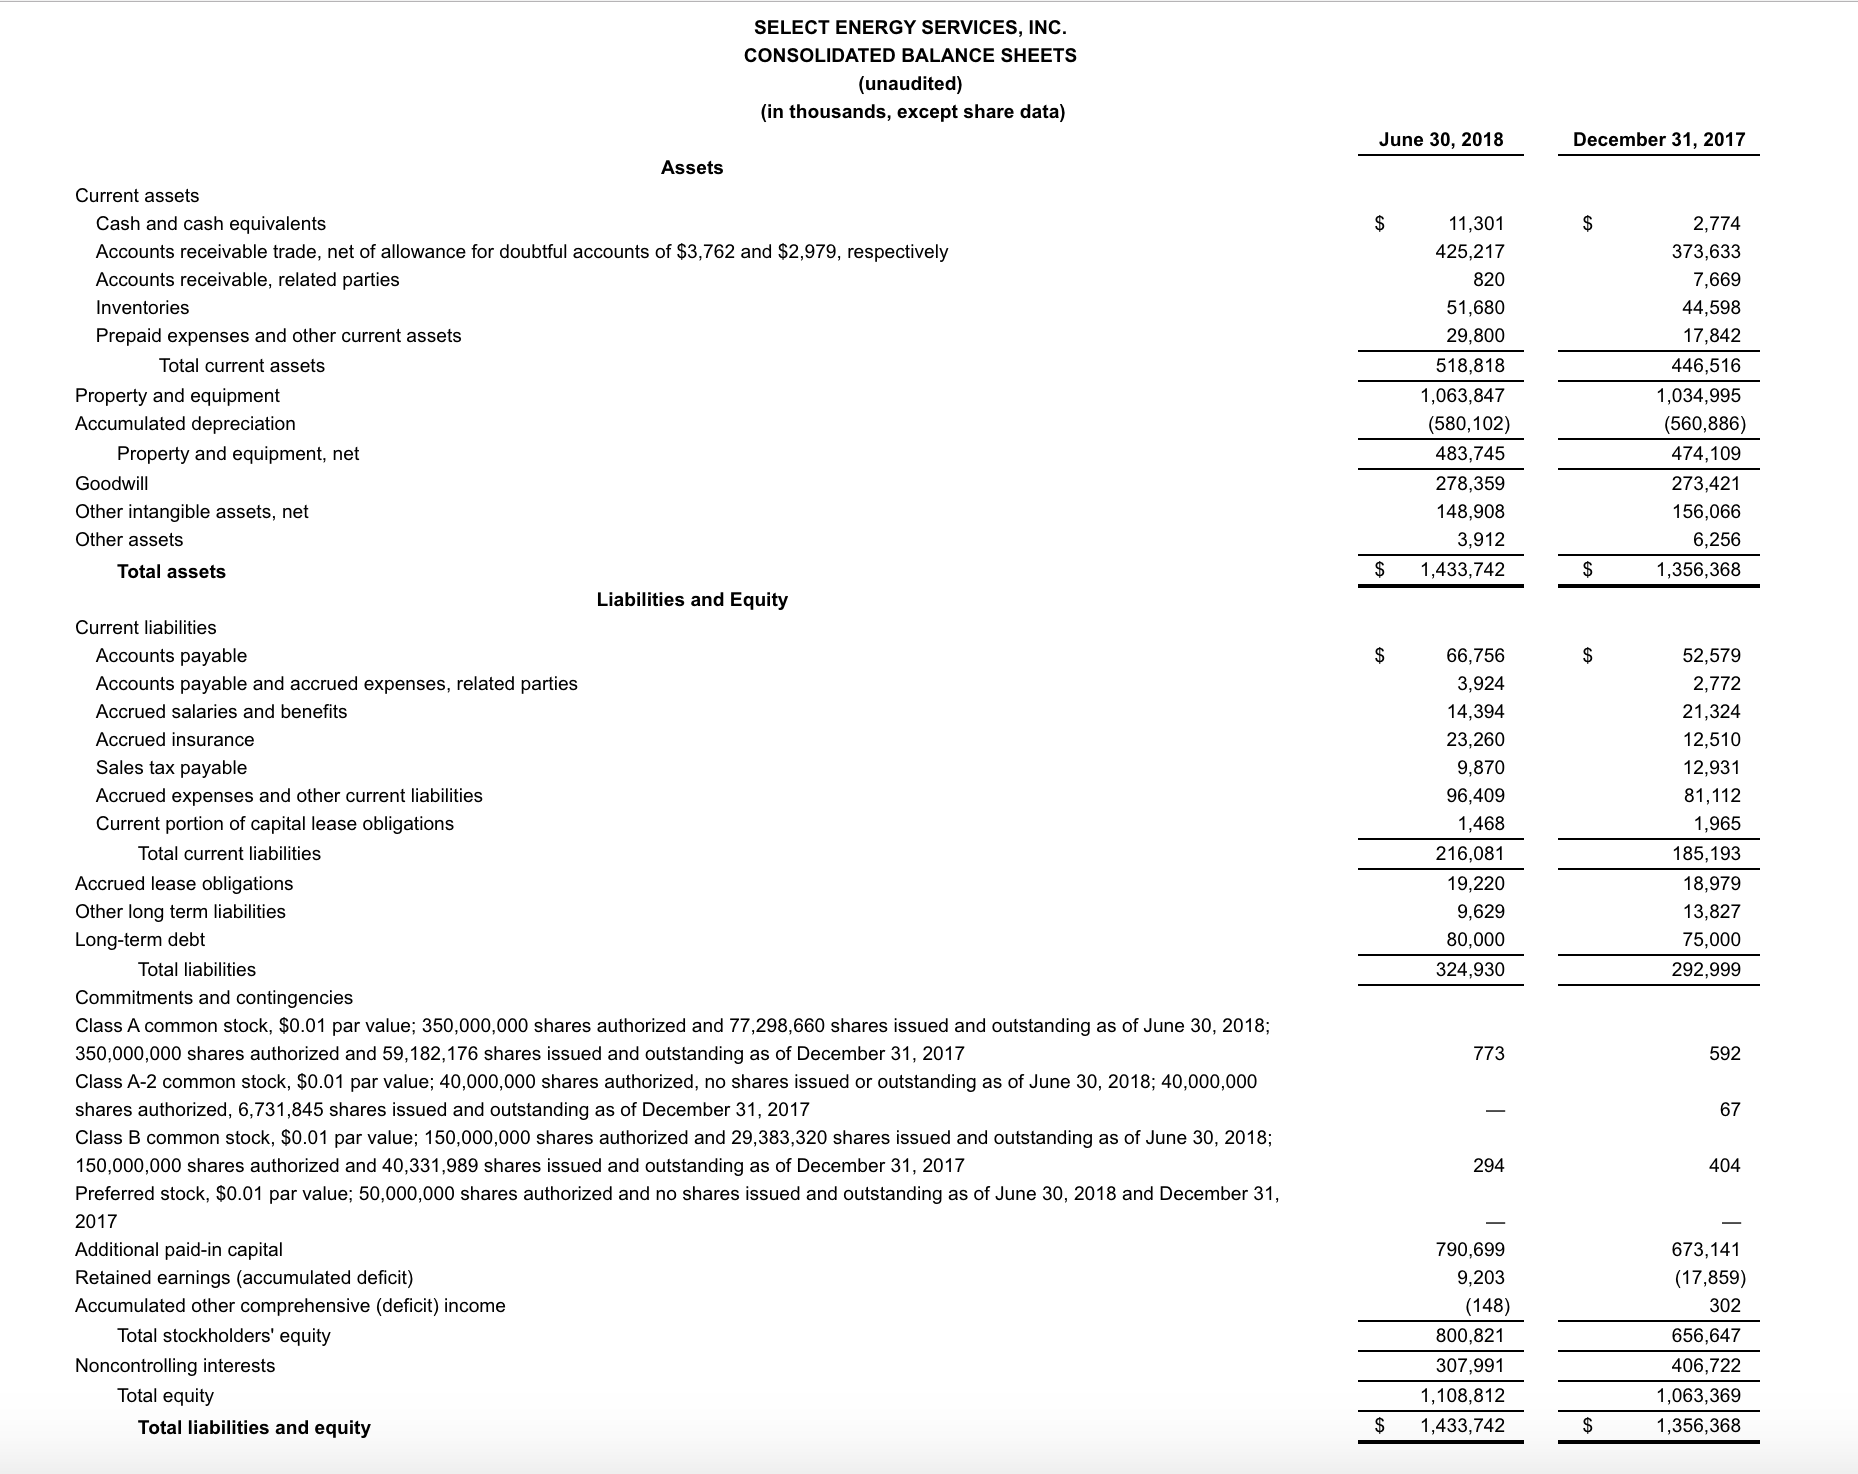
Total liquidity was $199.9 million as of June 30, 2018, as compared to $166.9 million as of March 31, 2018. The Company had approximately $188.6 million of available borrowing capacity under its revolving credit facility, after giving effect to $18.3 million of outstanding letters of credit. Total cash and cash equivalents were $11.3 million at June 30, 2018 as compared to $6.1 million at March 31, 2018, and outstanding borrowings as of June 30, 2018 totaled $80.0 million.
Conference Call
Select has scheduled a conference call on Friday, August 10, 2018 at 10:00 a.m. Eastern time. Please dial 201-389-0872 and ask for the Select Energy Services call at least 10 minutes prior to the start time of the call, or listen to the call live over the Internet by logging on to the website at the address http://investors.selectenergyservices.com/events-and-presentations. A telephonic replay of the conference call will be available through August 24, 2018 and may be accessed by calling 201-612-7415 using passcode 13680753#. A webcast archive will also be available at the link above shortly after the call and will be accessible for approximately 90 days.
About Select Energy Services, Inc.
Select is a leading provider of total water management and chemical solutions to the North American unconventional oil and gas industry. Select provides for the sourcing and transfer of water, both by permanent pipeline and temporary hose, prior to its use in the drilling and completion activities associated with hydraulic fracturing, as well as complementary water-related services that support oil and gas well completion and production activities, including containment, monitoring, treatment and recycling, flowback, hauling, and disposal. Select, under its Rockwater Energy Solutions brand, develops and manufactures a full suite of specialty chemicals used in the well completion process and production chemicals used to enhance performance over the producing life of a well. Select currently provides services to exploration and production companies and oilfield service companies operating in all the major shale and producing basins in the United States and Western Canada. For more information, please visit Select’s website, https://www.selectenergy.com.
Cautionary Statement Regarding Forward-Looking Statements
All statements in this communication other than statements of historical facts are forward-looking statements which contain our current expectations about our future results. We have attempted to identify any forward-looking statements by using words such as “expect,” “will,” “estimate” and other similar expressions. Although we believe that the expectations reflected, and the assumptions or bases underlying our forward-looking statements are reasonable, we can give no assurance that such expectations will prove to be correct. Such statements are not guarantees of future performance or events and are subject to known and unknown risks and uncertainties that could cause our actual results, events or financial positions to differ materially from those included within or implied by such forward-looking statements. Factors that could materially impact such forward-looking statements include, but are not limited to, the factors discussed or referenced in the “Risk Factors” section of our Annual Report on Form 10-K for the year ended December 31, 2017 and in any subsequently filed quarterly reports on Form 10-Q or current reports on Form 8-K. Investors should not place undue reliance on our forward-looking statements. Any forward-looking statement speaks only as of the date on which such statement is made, and we undertake no obligation to publicly update or revise any forward-looking statement, whether as a result of new information, future events, changed circumstances or otherwise, unless required by law.
WTTR-ER
Comparison of Non-GAAP Financial Measures
EBITDA, Adjusted EBITDA, gross profit before depreciation and amortization (D&A) and gross margin before D&A are not financial measures presented in accordance with GAAP. We define EBITDA as net income, plus interest expense, taxes and depreciation & amortization. We define Adjusted EBITDA as EBITDA plus/(minus) loss/(income) from discontinued operations, plus any impairment charges or asset write-offs pursuant to GAAP, plus/(minus) non-cash losses/(gains) on the sale of assets or subsidiaries, non-recurring compensation expense, non-cash compensation expense, and non-recurring or unusual expenses or charges, including severance expenses, transaction costs, or facilities-related exit and disposal-related expenditures, plus/(minus) foreign currency losses/(gains) and plus any inventory write-downs. We define gross profit before D&A as revenue less cost of revenue, excluding cost of sales D&A expense. We define gross margin before D&A as gross profit before D&A divided by revenue. EBITDA, Adjusted EBITDA, gross profit before D&A and gross margin before D&A are supplemental non-GAAP financial measures that we believe provide useful information to external users of our financial statements, such as industry analysts, investors, lenders and rating agencies because it allows them to compare our operating performance on a consistent basis across periods by removing the effects of our capital structure (such as varying levels of interest expense), asset base (such as depreciation and amortization) and non-recurring items outside the control of our management team. We present EBITDA, Adjusted EBITDA, gross profit before D&A and gross margin before D&A because we believe they provide useful information regarding the factors and trends affecting our business in addition to measures calculated under GAAP.
Net income is the GAAP measure most directly comparable to EBITDA and Adjusted EBITDA. Gross profit is the GAAP measure most directly comparable to gross profit before D&A. Our non-GAAP financial measures should not be considered as alternatives to the most directly comparable GAAP financial measure. Each of these non-GAAP financial measures has important limitations as an analytical tool due to exclusion of some but not all items that affect the most directly comparable GAAP financial measures. You should not consider EBITDA, Adjusted EBITDA or gross profit before D&A in isolation or as substitutes for an analysis of our results as reported under GAAP. Because EBITDA, Adjusted EBITDA and gross profit before D&A may be defined differently by other companies in our industry, our definitions of these non-GAAP financial measures may not be comparable to similarly titled measures of other companies, thereby diminishing their utility. For further discussion, please see “Item 6. Selected Financial Data” in our Annual Report on Form 10-K for the year ended December 31, 2017.
The following tables present a reconciliation of EBITDA and Adjusted EBITDA to our net income (loss), which is the most directly comparable GAAP measure for the periods presented:
The following tables present a reconciliation of gross profit before D&A to total gross profit, which is the most directly comparable GAAP measure, and a calculation of gross margin before D&A for the periods presented:
Contacts:
Select Energy Services
Nick Swyka – CFO & SVP
Chris George, VP, Investor Relations & Treasurer
(713) 296-1073
IR@selectenergyservices.com
Dennard – Lascar Associates
Ken Dennard / Lisa Elliott
713.529.6600
WTTR@dennardlascar.com
SOURCE Select Energy Services, Inc.
http://investors.selectenergyservices.com/news-releases/2018/08-09-2018-213044565