Select Energy Services Reports Third Quarter 2018 Financial and Operational Results
Nov 06, 2018
HOUSTON, Nov. 6, 2018 /PRNewswire/ — Select Energy Services, Inc. (NYSE: WTTR) (“Select” or “the Company”), a leading provider of total water management and chemical solutions to the North American unconventional oil and gas industry, today announced results for the third quarter ended September 30, 2018.
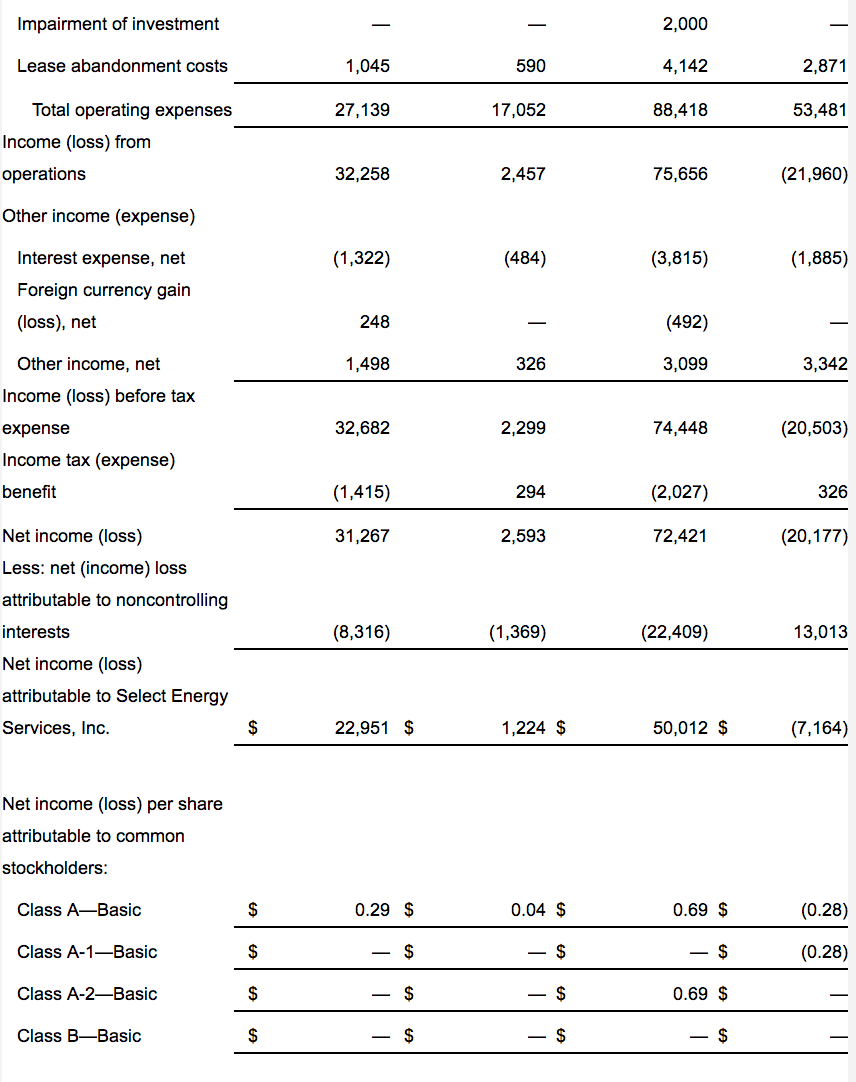
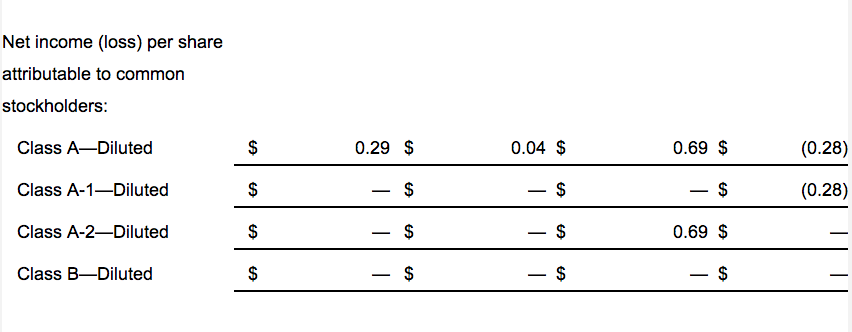
Revenue for the third quarter of 2018 was $397.0 million as compared to $393.2 million in the second quarter of 2018 and $153.9 million in the third quarter of 2017. Net income for the third quarter of 2018 was $31.3 million as compared to $25.0 million in the second quarter of 2018 and $2.6 million in the third quarter of 2017. Earnings per share measured $0.29 as compared to $0.24 in the second quarter of 2018 and $0.04 in the third quarter of 2017.
Holli Ladhani, President and CEO, stated, “I am pleased with the execution of the Select team in driving our best-ever financial performance on virtually all of our key metrics. In particular, net income grew 25% sequentially and operating cash flow was in excess of $60 million, which more than doubled our second quarter total. We increased revenue, despite industry-specific challenges that emerged in the latter half of the quarter, and improved margins across all three segments of the Company. Operationally, we drove record volumes through our GRR infrastructure system in the Northern Delaware area of the Permian Basin and saw positive customer reception to our recently introduced proprietary high-viscosity friction reducer line produced in-basin at our expanded Midland facility.
“There has been considerable discussion in the market regarding the transient challenges related to Permian takeaway constraints and the degree to which operator budgets were expended over the first three quarters of 2018. However, as 2019 budgets are put into effect, we expect our customer base will return to investing in U.S. unconventional well completions in 2019, as they continued building the backlog of drilled but uncompleted wells with a steady rig count through the third quarter up to today. Additionally, we believe the unique dynamics of the water sector provide a greater degree of pricing stability relative to certain other completions-oriented services. While a temporary decline in completions activity will affect our revenues, we believe we are well positioned to support the progress we’ve made in improving our margins over the course of the year. Given the growth we expect to see in U.S. onshore completions activity in 2019 and beyond, we will continue to allocate capital judiciously to create value for our shareholders,” concluded Ladhani.
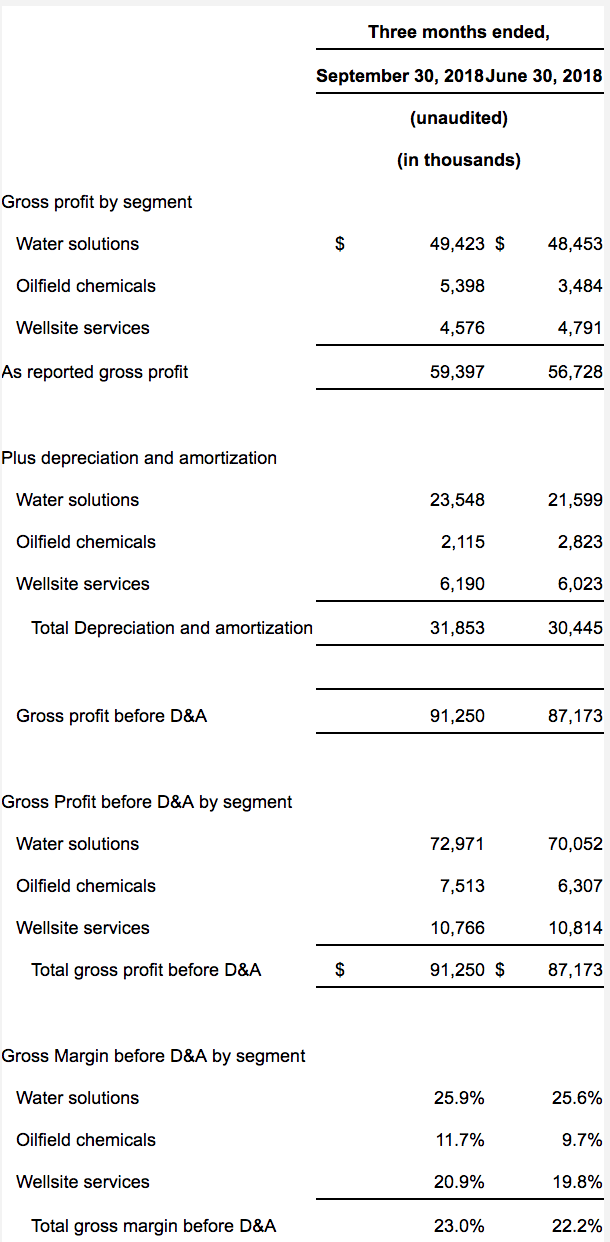
Gross profit was $59.4 million in the third quarter of 2018 as compared to $56.7 million in the second quarter of 2018 and $19.5 million in the third quarter of 2017. Total gross margin for Select was 15.0% in the third quarter of 2018 as compared to 14.4% in the second quarter of 2018 and 12.7% in the third quarter of 2017. Gross margin before depreciation and amortization (“D&A”) for the third quarter of 2018 was 23.0% as compared to 22.2% for the second quarter of 2018.
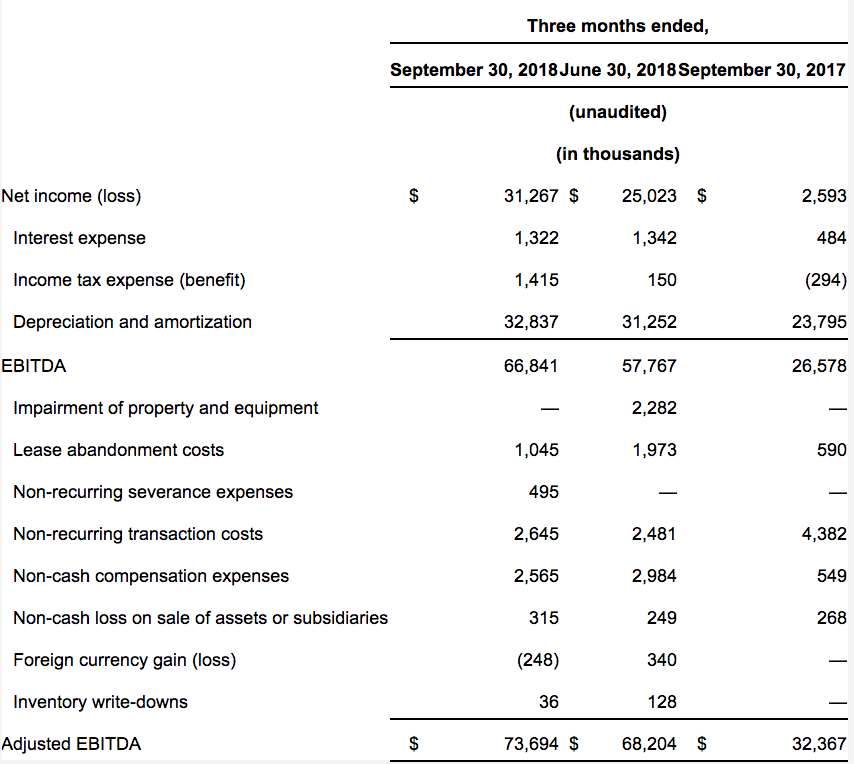
Adjusted EBITDA was $73.7 million or 18.6% of revenue in the third quarter of 2018 as compared to $68.2 million or 17.3% of revenue in the second quarter of 2018. Please refer to the reconciliations of gross profit before D&A (a non-GAAP measure) to gross profit and of Adjusted EBITDA (a non-GAAP measure) to net income at the end of this news release.
Business Segment Information
The Water Solutions segment generated revenues of $281.4 million in the third quarter of 2018 as compared to revenues of $273.7 million in the second quarter of 2018 and $125.1 million in the third quarter of 2017. This growth was driven primarily by increased revenues in our water sourcing and transfer operations, particularly those associated with our GRR footprint, as well as our Flowback and Well Testing operations. Gross margin before depreciation and amortization (“D&A”) for Water Solutions was 25.9% in the third quarter of 2018 as compared to 25.6% in the second quarter of 2018. Water Solutions gross margin before D&A was impacted by $2.5 million of non-recurring merger-related rebranding costs. We do not expect to incur material merger-related costs after the third quarter.
The Oilfield Chemicals segment, which operates through our subsidiary Rockwater Energy Solutions, generated revenues of $64.0 million in the third quarter of 2018 as compared to $64.8 million in the second quarter of 2018. Gross margin before D&A for Oilfield Chemicals was 11.7% in the third quarter of 2018 as compared to 9.7% in the second quarter of 2018. While revenues were relatively flat, in line with activity, margins benefitted from the expansion of in-basin production at Midland, improved product mix and new contracts in our Production Chemicals service line.
The Wellsite Services segment generated revenues of $51.6 million in the third quarter of 2018 as compared to revenues of $54.7 million in the second quarter of 2018 and $28.8 million in the third quarter of 2017. Increased revenues in our rentals and accommodations business line was more than offset by declines in our Canadian operations following the closure of three underperforming yards resulting from recent declines in Canadian activity. Gross margin before D&A for Wellsite Services was 20.9% in the third quarter of 2018 as compared to 19.8% in the second quarter of 2018.
Our consolidated Adjusted EBITDA during the quarter includes adjustments for certain non-recurring items including $2.6 million of transaction costs, primarily related to the earlier referenced rebranding efforts that are not expected to continue after the third quarter, as well as $1.0 million of lease abandonment costs and $0.5 million of severance expense, primarily related to the closure of three underperforming Canadian yards within our Wellsite Services group. Non-cash compensation expense accounted for an additional $2.6 million of adjustment, and other items produced a net impact of $0.1 million.
Included in the second and third quarter of 2018 segment results were full-quarter contributions from Rockwater Energy Solutions, which Select acquired in November 2017; as such, these results are not included in the third quarter 2017 results and are not directly comparable.
Cash Flow and Balance Sheet
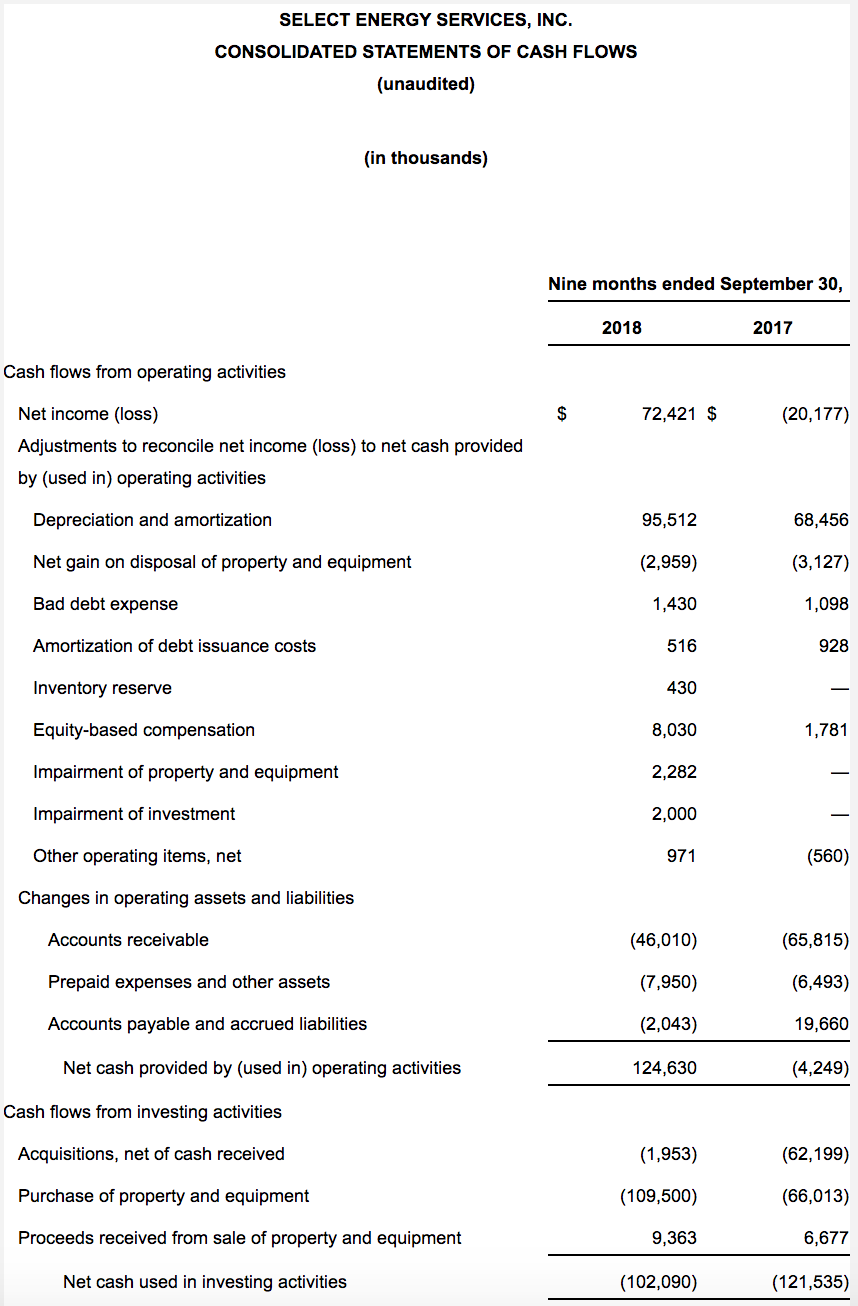
Cash flow from operations for the nine-month period ending September 30, 2018 was $124.6 million, of which $60.3 million was generated in the third quarter of 2018. Higher net income and modestly improved working capital management drove the expansion in cash flow. Capital expenditures for the first nine months of 2018 were $100.1 million, net of asset sales of $9.4 million, of which $41.0 million was spent in the third quarter of 2018. Both our 2018 year-to-date and third quarter net capital expenditures were fully funded with cash flow from operations.
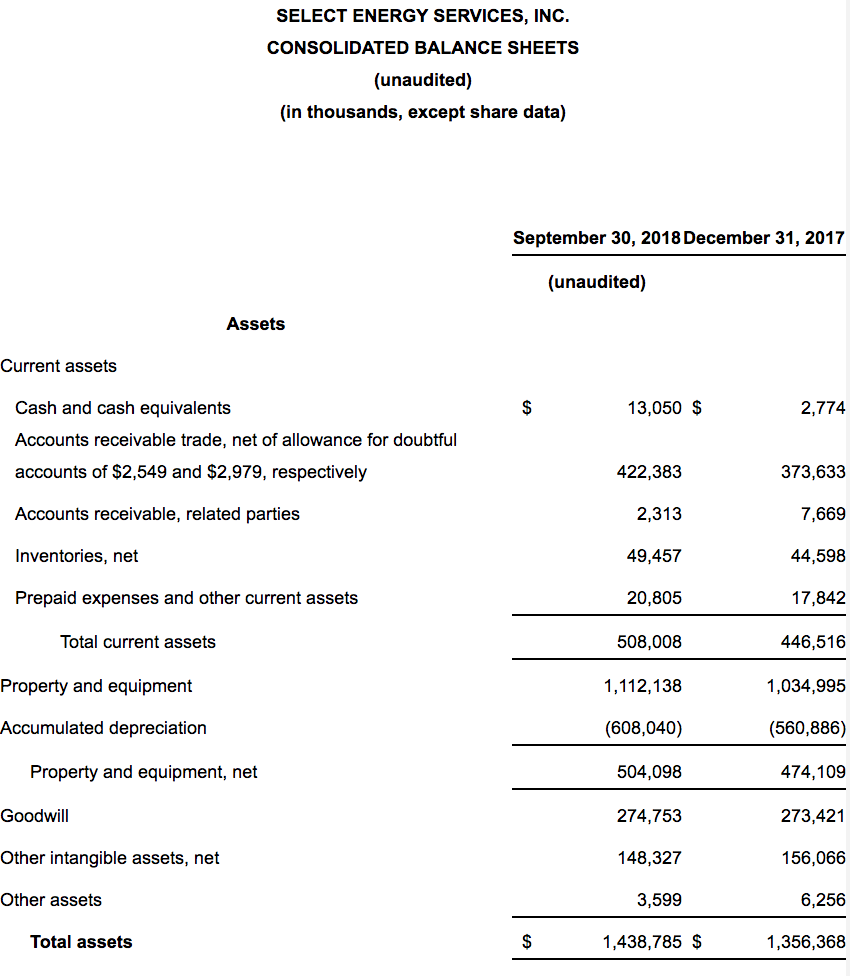
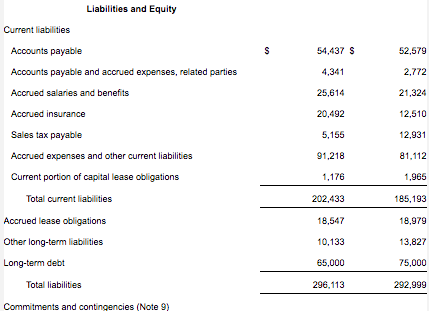
Total liquidity was $218.1 million as of September 30, 2018, as compared to $199.9 million as of June 30, 2018. Outstanding borrowings under the Company’s revolving credit facility totaled $65.0 million as of September 30, 2018, compared to $80.0 million as of June 30, 2018. The Company repaid an additional $10.0 million on this facility subsequent to the close of the third quarter of 2018. As of September 30, 2018, the Company had approximately $205.0 million of available borrowing capacity under its revolving credit facility, after giving effect to $20.8 million of outstanding letters of credit. Total cash and cash equivalents were $13.1 million at September 30, 2018 as compared to $11.3 million at June 30, 2018.
Conference Call
Select has scheduled a conference call on Wednesday, November 7, 2018 at 10:00 a.m. Eastern time / 9:00 a.m. Central time. Please dial 201-389-0872 and ask for the Select Energy Services call at least 10 minutes prior to the start time of the call, or listen to the call live over the Internet by logging on to the website at the address http://investors.selectenergyservices.com/events-and-presentations. A telephonic replay of the conference call will be available through November 21, 2018 and may be accessed by calling 201-612-7415 using passcode 13683114#. A webcast archive will also be available at the link above shortly after the call and will be accessible for approximately 90 days.
About Select Energy Services, Inc.
Select is a leading provider of total water management and chemical solutions to the North American unconventional oil and gas industry. Select provides for the sourcing and transfer of water, both by permanent pipeline and temporary hose, prior to its use in the drilling and completion activities associated with hydraulic fracturing, as well as complementary water-related services that support oil and gas well completion and production activities, including containment, monitoring, treatment and recycling, flowback, hauling, and disposal. Select, under its Rockwater Energy Solutions subsidiary, develops and manufactures a full suite of specialty chemicals used in the well completion process and production chemicals used to enhance performance over the producing life of a well. Select currently provides services to exploration and production companies and oilfield service companies operating in all the major shale and producing basins in the United States and Western Canada. For more information, please visit Select’s website, https://www.selectenergy.com.
Cautionary Statement Regarding Forward-Looking Statements
All statements in this communication other than statements of historical facts are forward-looking statements which contain our current expectations about our future results. We have attempted to identify any forward-looking statements by using words such as “expect,” “will,” “estimate” and other similar expressions. Although we believe that the expectations reflected, and the assumptions or bases underlying our forward-looking statements are reasonable, we can give no assurance that such expectations will prove to be correct. Such statements are not guarantees of future performance or events and are subject to known and unknown risks and uncertainties that could cause our actual results, events or financial positions to differ materially from those included within or implied by such forward-looking statements. Factors that could materially impact such forward-looking statements include, but are not limited to, the factors discussed or referenced in the “Risk Factors” section of our Annual Report on Form 10-K for the year ended December 31, 2017 and in any subsequently filed quarterly reports on Form 10-Q or current reports on Form 8-K. Investors should not place undue reliance on our forward-looking statements. Any forward-looking statement speaks only as of the date on which such statement is made, and we undertake no obligation to publicly update or revise any forward-looking statement, whether as a result of new information, future events, changed circumstances or otherwise, unless required by law.
WTTR-ER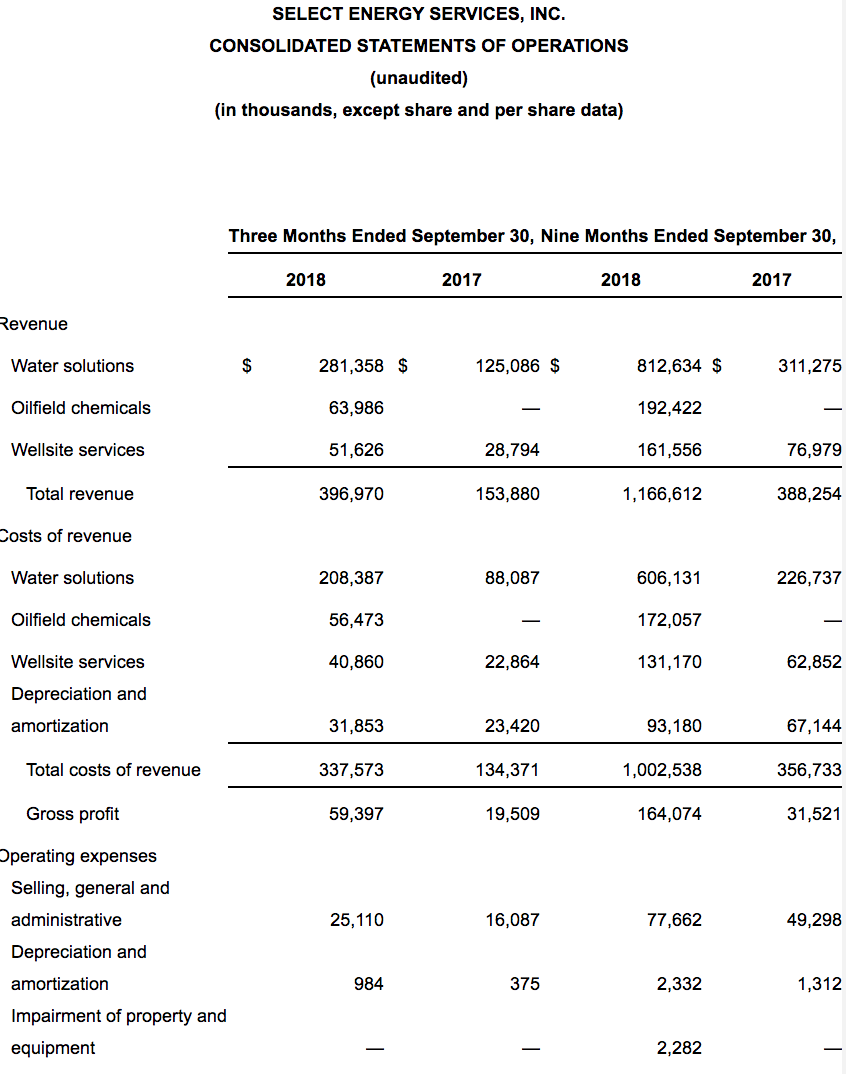

Comparison of Non-GAAP Financial Measures
EBITDA, Adjusted EBITDA, gross profit before depreciation and amortization (D&A) and gross margin before D&A are not financial measures presented in accordance with GAAP. We define EBITDA as net income, plus interest expense, taxes and depreciation & amortization. We define Adjusted EBITDA as EBITDA plus/(minus) loss/(income) from discontinued operations, plus any impairment charges or asset write-offs pursuant to GAAP, plus/(minus) non-cash losses/(gains) on the sale of assets or subsidiaries, non-recurring compensation expense, non-cash compensation expense, and non-recurring or unusual expenses or charges, including severance expenses, transaction costs, or facilities-related exit and disposal-related expenditures, plus/(minus) foreign currency losses/(gains) and plus any inventory write-downs. We define gross profit before D&A as revenue less cost of revenue, excluding cost of sales D&A expense. We define gross margin before D&A as gross profit before D&A divided by revenue. EBITDA, Adjusted EBITDA, gross profit before D&A and gross margin before D&A are supplemental non-GAAP financial measures that we believe provide useful information to external users of our financial statements, such as industry analysts, investors, lenders and rating agencies because it allows them to compare our operating performance on a consistent basis across periods by removing the effects of our capital structure (such as varying levels of interest expense), asset base (such as depreciation and amortization) and non-recurring items outside the control of our management team. We present EBITDA, Adjusted EBITDA, gross profit before D&A and gross margin before D&A because we believe they provide useful information regarding the factors and trends affecting our business in addition to measures calculated under GAAP.
Net income is the GAAP measure most directly comparable to EBITDA and Adjusted EBITDA. Gross profit is the GAAP measure most directly comparable to gross profit before D&A. Our non-GAAP financial measures should not be considered as alternatives to the most directly comparable GAAP financial measure. Each of these non-GAAP financial measures has important limitations as an analytical tool due to exclusion of some but not all items that affect the most directly comparable GAAP financial measures. You should not consider EBITDA, Adjusted EBITDA or gross profit before D&A in isolation or as substitutes for an analysis of our results as reported under GAAP. Because EBITDA, Adjusted EBITDA and gross profit before D&A may be defined differently by other companies in our industry, our definitions of these non-GAAP financial measures may not be comparable to similarly titled measures of other companies, thereby diminishing their utility. For further discussion, please see “Item 6. Selected Financial Data” in our Annual Report on Form 10-K for the year ended December 31, 2017.
The following tables present a reconciliation of EBITDA and Adjusted EBITDA to our net income (loss), which is the most directly comparable GAAP measure for the periods presented:
The following tables present a reconciliation of gross profit before D&A to total gross profit, which is the most directly comparable GAAP measure, and a calculation of gross margin before D&A for the periods presented:
Contacts:
Select Energy Services
Nick Swyka – CFO & SVP
Chris George, VP, Investor Relations & Treasurer
(713) 296-1073
IR@selectenergyservices.com
Dennard – Lascar Associates
Ken Dennard / Lisa Elliott
713.529.6600
WTTR@dennardlascar.com
View original content:http://www.prnewswire.com/news-releases/select-energy-services-reports-third-quarter-2018-financial-and-operational-results-300745149.html
SOURCE Select Energy Services, Inc.